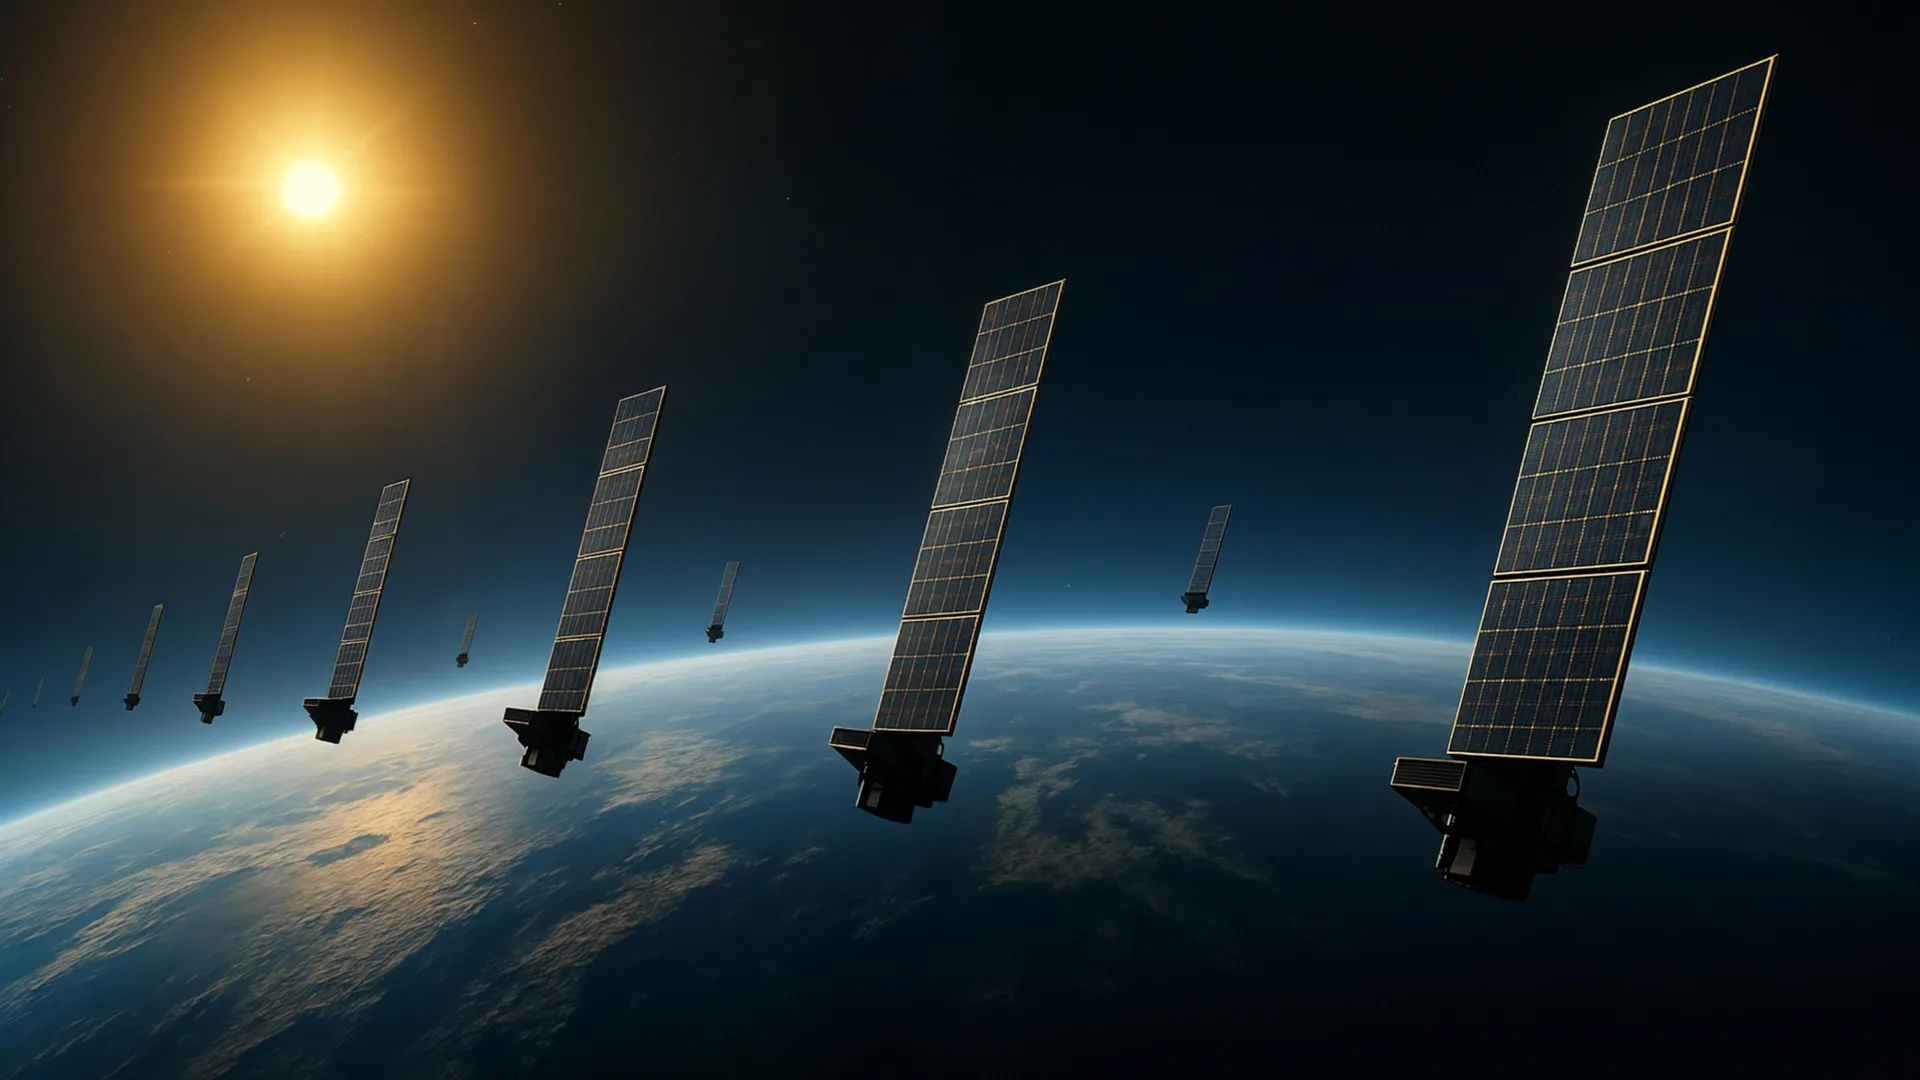
Киотогийн их сургуулийн судлаачид Starlink хиймэл дагуулын өгөгдлийг ашиглан агаар мандлын нягтыг тодорхойлох томографийн шинэ аргыг нэвтрүүлсэн байна.
Дэлхийн орчимд хиймэл дагуул болон сансрын хог хаягдал олширч байгаатай холбогдуулан дэлхийн гадаргаас 100–1000 км-ийн өндөрт орших термоссферийн нягтыг нарийвчлан хэмжих шаардлага тулгарч байна. Термоссферийн нягт нь хиймэл дагуулын хөдөлгөөнд нөлөөлж, улмаар мөргөлдөх эрсдэлийг нэмэгдүүлдэг тул энэхүү бүсийг ажиглах нь сансрын инженерчлэлд чухал ач холбогдолтой юм.
Киотогийн их сургуулийн судлаач Мамору Ямамото болон түүний багийнхан сансрын шинжлэх ухаан, инженерчлэлийн чиглэлийг нэгтгэн, анагаах ухааны дүрслэлд ашигладаг томографийн аргыг агаар мандлын судалгаанд хэрэглэжээ. Тэд 482 км-ийн өндөрт нисэж буй 1200 орчим Starlink хиймэл дагуулын тойрог замын өөрчлөлтийг ажиглах замаар термоссферийн нягтыг тооцоолсон байна.
Энэхүү судалгаагаар дэлхийн гадаргаас 500 орчим км өндөрт орших термоссферийн нягтын хоёр хэмжээст газрын зургийг анх удаа бүтээжээ. Үр дүн нь ESA-гийн SWARM хиймэл дагуулын ажиглалттай өндөр нийцтэй байгаа нь уг аргын нарийвчлалыг баталж байна.
Энэхүү шинэ арга нь хиймэл дагуулын хөдөлгөөнийг илүү нарийвчлалтай урьдчилан таамаглах, сансрын хог хаягдлаас үүдэлтэй мөргөлдөөний эрсдэлийг бууруулахад туслах юм. Цаашид уг технологийг агаар мандлын нягтыг бодит цаг хугацаанд хэмжих, сансрын цаг агаарын урьдчилсан мэдээг сайжруулахад ашиглах боломжтой гэж судлаачид үзэж байна.
Дэлгэрэнгүйг эх сурвалжаас харах
↓Эх сурвалжийг нээх ↓
The region surrounding Earth is getting more crowded as thousands of satellites and pieces of space debris move through low Earth orbit. Farther above, at altitudes of several hundred kilometers, traces of Earth’s upper atmosphere can still exert enough drag to slow satellites. Accurately measuring atmospheric density at these heights is therefore important for forecasting satellite motion and reducing the risk of collisions.
More than 99 percent of the upper atmosphere consists of electrically neutral gas known as the thermosphere. The term thermospheric density refers to the density of this neutral atmosphere between about 100 and 1000 kilometers above Earth’s surface. By comparison, the ionized gas of the ionosphere accounts for less than 1 percent of the atmosphere. Because ionized gas affects the way radio waves travel, the ionosphere is relatively straightforward to observe. Measuring conditions in the thermosphere is much more difficult.
A New Way to Observe the Thermosphere
Better measurements of thermospheric density could advance research into the upper atmosphere while also providing valuable information for space engineering. Motivated by both needs, researchers at Kyoto University developed a new technique for visualizing this difficult-to-observe region.
“This is a multidisciplinary study between space science and space engineering,” says corresponding author Mamoru Yamamoto. “Reading papers from both research fields, we realized that deeper dialogue between researchers from both fields is necessary.”
The researchers used publicly available orbital information from Starlink satellites and applied tomography, a technique commonly associated with medical imaging, to Earth’s upper atmosphere. By examining atmospheric drag through the gradual decay of satellite orbits, the team estimated thermospheric density around approximately 1,200 satellites flying at an altitude of 482 kilometers.
Building a Two-Dimensional Atmospheric Map
Using those measurements, the researchers produced a two-dimensional latitude-longitude snapshot of thermospheric density at an altitude of roughly 500 kilometers. According to the team, this represents the first tomographic analysis of its kind.
The resulting density patterns also showed strong consistency with observations from the European Space Agency’s SWARM satellites, which measure changes in atmospheric density along their orbital paths.
The work expands on an earlier study by the same team. In that research, scientists estimated how thermospheric density changed over time and altitude using general orbital information called Two-Line Element, or TLE, data from Starlink satellites. The new analysis adds another dimension by examining how density varies horizontally across latitude and longitude, revealing more of the thermosphere’s geographic structure.
Making Crowded Orbits Safer
The findings could have practical benefits as the number of objects orbiting Earth continues to grow. More accurate information about atmospheric density can improve predictions of satellite motion, helping reduce the chance of collisions between satellites and between satellites and space debris.
The technique could also eventually support near-real-time measurements of atmospheric density around satellites. Such monitoring could improve space weather forecasting and contribute to safer, more dependable satellite operations in the future.