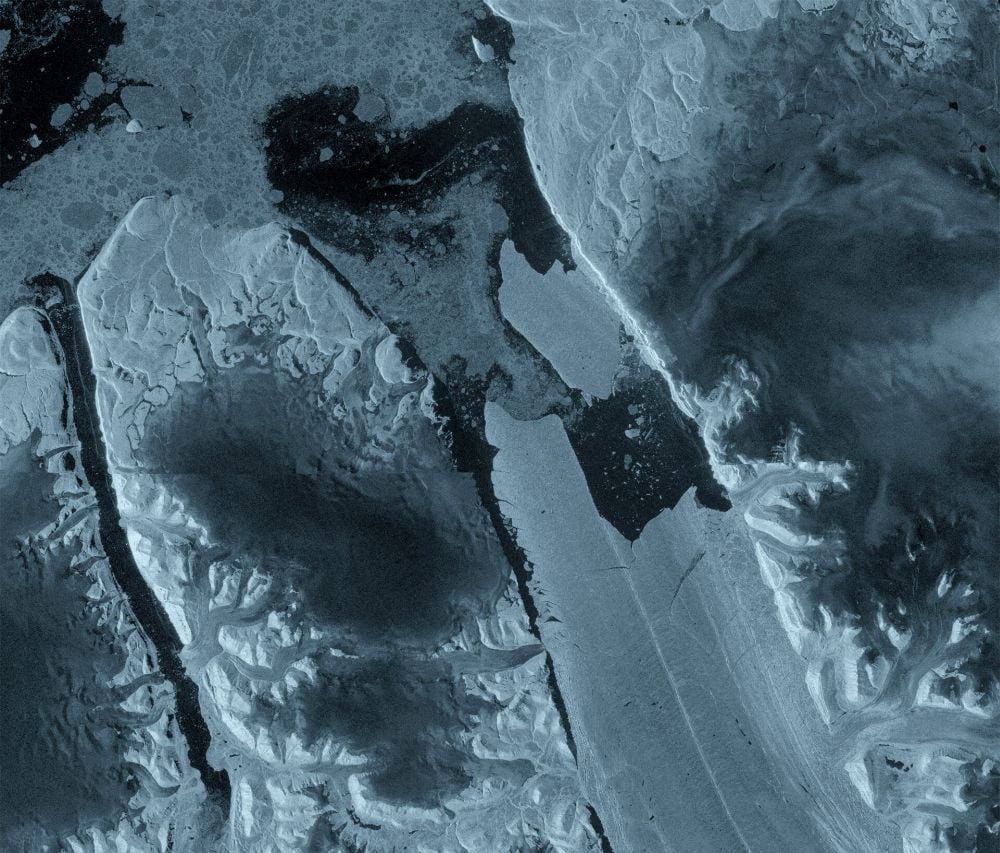
Европын сансрын агентлагийн хиймэл дагуулын ажиглалтаар Гренландын хойд хэсгийн Петерманн мөсөн голоос 76 хавтгай дөрвөлжин км талбай бүхий асар том мөсөн хэл тасарчээ.
Европын сансрын агентлагийн (ESA) Copernicus Sentinel-1 хиймэл дагуулын мэдээллээр, наймдугаар сарын эхээр болсон энэхүү үйл явдал нь 2012 оноос хойших тус мөсөн голын хамгийн том, 2020 оноос хойших Арктикийн бүс нутаг дахь хамгийн томоохон мөс тасрах тохиолдол боллоо. Тус мөсөн голын 70 км орчим үргэлжилсэн хөвөгч мөсөн хэл нь мөсөн голын урсгалыг далай руу хурдан шилжихээс хамгаалж, “бөглөөний” үүрэг гүйцэтгэдэг байв. Энэхүү мөсөн хэсэг тасарч, 150 метр хүртэл зузаантай мөсөн уул болж хөвснөөр мөсөн голын далай руу чиглэсэн урсгал хурдасч, мөсний алдагдал нэмэгдэх төлөвтэй байна.
Судлаачид “grounding line” буюу мөсөн голын хуурай газар дээрх хэсэг болон усан дээр хөвж буй хэсгийг заагладаг шугамын орчимд гарч буй өөрчлөлтийг 2019 оноос хойш тусгайлан хянаж ирсэн юм. Эрдэмтэн Мартин Вэйрингийн тайлбарласнаар, ийм төрлийн том мөсөн уулс Арктикт ховор тохиолддог тул мөсөн масс хэрхэн шилжиж, задарч буйг судлах онцгой боломж бүрдэж байна. Мөн хиймэл дагуулын радиолокацийн өгөгдөл нь мөсөн голын хагарал, хөдөлгөөнийг бодит цаг хугацаанд нарийвчлан хянах боломжийг олгосон нь шинжлэх ухааны хувьд чухал ач холбогдолтой юм.
Энэхүү үйл явдал нь Арктикийн уур амьсгалын өөрчлөлтийн нэгэн тод илрэл бөгөөд Петерманн мөсөн голын орчимд дахин 97 болон 87 хавтгай дөрвөлжин км талбай бүхий хоёр том хэсэг тасрах эрсдэлтэй байна. 1990-ээд оноос хойш хиймэл дагуулын тусламжтайгаар хийсэн олон жилийн ажиглалтын үр дүнд Гренландын мөсөн бүрхүүл улам бүр нимгэрч, мөсний алдагдал эрчимжиж байгаа нь эргэлзээгүй баримт болон тогтоогджээ.
Дэлгэрэнгүйг эх сурвалжаас харах
Эх сурвалжийг нээх ↓
A recent Copernicus Sentinel-1 image shows that a 76 sq km chunk ice broke away from one of Greenland’s glaciers in early August. It came from the Petermann Glacier in northwest Greenland. The European Space Agency says this is “the glacier’s largest loss of floating ice since 2012 and the most significant calving event in the Arctic since 2020.”
The ESA’s Copernicus Sentinel-1 satellite is a constellation of satellites that monitors Earth from its ~700 km high, near-polar orbit, paying close attention to the loss of sea-ice. The satellites employ radar, meaning they can observe Earth’s surface regardless of time-of-day, dark polar winters, or cloud cover. Scientists working with Sentinel-1 take its radar data and create black and white images of Greenland ice, and even create composite colour images.
These observations are part of a specific monitoring campaign that started in 2019 and focuses on the Petermann Glacier. Researchers are focusing on it because of its significant floating ice tongue that extended about 70 km into the fjord. The ice tongue acted as a sort of plug that slowed the flow of glacier ice into the ocean. Now that it’s gone, the flow of those glaciers into the ocean will accelerate. That means faster ice loss.
When monitoring this type of ice loss, scientists work with the idea of the ‘grounding line.’ This is the line that divides the part of a glacier resting on the ground from the part floating on water. Now that this 76 sq. km. tongue of ice has broken away, the glacial ice flow can accelerate. The faster ice moves across the grounding line, the faster the glacier is losing ice.
Greenland’s glaciers flow from high elevation to low elevation, and into the ocean through deep-cut fjords. Snowfall reconstitutes the glaciers at their upper elevations, and is the input for the flow. The tongue beyond the grounding line slowed the movement of the glacier ice into the ocean, where the flow terminates.
So now a chunk of Petermann Glacier that was helping slow the flow of ice into the ocean is floating as a tabular iceberg up to 150 meters (500 ft) thick. It will drift, maybe run aground for a while, but over time it will fracture, and drift into warmer waters and melt away.
Scientists will monitor the iceberg as it drifts and deteriorates, to learn more about the process. They’ll also track it because it has the potential to drift into busy shipping lanes.
“This type of large tabular iceberg is relatively rare in the Arctic, making this calving event a unique opportunity to study how such a vast ice mass drifts, evolves and eventually breaks apart,” said the ESA’s Martin Wearing. Wearing is a Digital Twin Earth Scientist at the European Space Agency’s Centre for Earth Observation.
“Satellite missions such as Sentinel-1 provide the systematic, long-term observations needed to track these changes, helping scientists better understand the processes driving calving and the wider impacts on the polar environment, and ultimately the Earth system as a whole,” Wearing said.
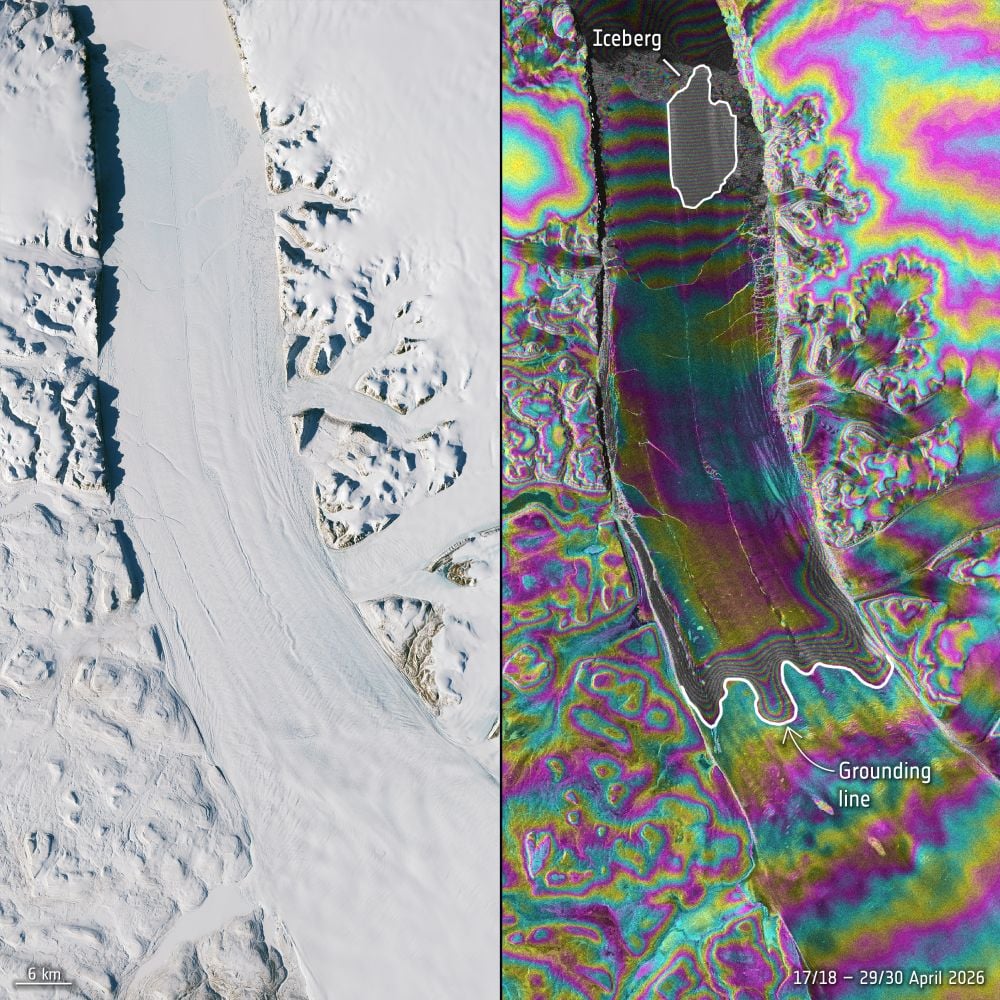 The image on the left is an optical image from Sentinel-2, and the image on the right is a radar interferometry image. The radar image shows fractures and deformations in the ice at the end of the Petermann glacier. These cracks and other features were apparent in April 2026, about four months before the calving event. The satellite repeatedly imaged the location daily to create this interferogram, and the images let scientists study the fracturing and movement of the ice tongue in detail. Image Credit: contains modified Copernicus Sentinel data (2026), processed by M. Hammond (University of Leeds) and ESA. Licence: CC BY-SA 3.0 IGO or ESA Standard Licence
This isn’t the first time in the last couple of decades that large chunks of ice have broken off of Petermann Glacier. But the last time was in 2012, and the floating tongue has been mostly stable for more than a decade. Only small calving events altered it.
“The changes we observed on Petermann Glacier were occurring very rapidly in the lead up to the iceberg calving event, so it was incredibly exciting to monitor the crack propagation with interferometry in near-real time,” said Molly Hammond, a PhD student from the Universtiy of Leeds, who processed the Sentinel-1 data. “This has demonstrated the incredible value of one-day repeat synthetic aperture data.”
Icebergs calving away where glacier flow terminates is just part of the picture of how glaciers flow from high elevations to low elevations. Glaciers rely on snow at their tops to balance out calving, and right now that balance is askew. A few years ago, for the first time since recording began in 1989, it rained on the highest point on Greenland’s ice sheet.
With increasing calving events like this one, and rain beginning to replace some snowfall in Greenland’s mountains, the picture of a warming Arctic is clear.
The chunk of ice that broke off will soon be just a memory. But the Petermann Glacier will calve again, maybe soon. Two more chunks appear close to breaking away. They’re approximately 97 and 87 sq km, and will break away as established cracks in the ice continue to propagate.
Earth-observing satellites like the Sentinel constellations continue to play a leading role in monitoring the effects of climate change in the polar regions. They deliver crystal-clear evidence of ice loss into anyone’s browser window. Since the late 1990s, satellites have revealed the changing conditions.
In 1997, the Journal of Climate published one of the first satellite-based studies that systematically tracked Greenland’s snowmelt. It showed a “significant increasing trend in melt area
of 4.4% per year from 1979–91.” That was a change from only a few years previous, where scientists had difficulty determining whether Greenland’s surface ice was growing, shrinking, or maintaining balance.
More comphrehensive research followed. In the year 2000, the journal Science published a paper showing that at elevations below 2,000 meters, Greenland’s ice is thinning.
In 2006, a landmark paper was published in Science that specifically looked at ice loss through glacier calving. It showed that in the prior decade, Greenland’s ice sheet mass deficit doubled in some regions and would only accelerate. “Accelerated ice discharge in the west and particularly in the east doubled the ice sheet mass deficit in the last decade from 90 to 220 cubic kilometers per year,” that paper stated.
20 years later, with many more satellite observations in hand, there is no longer any doubt about Greenland’s disappearing ice. In science, the conclusion is clear and has been clear for a long time: The polar landscape is being rapidly altered by climate change, and satellite observations of massive chunks of Greenland glaciers breaking off make it clear.


Гренландын мөсөн голууд яагаад хурдтай ууссаар байна вэ? Мөсөн голуудын өөрчлөлт байгальд ямар нөлөөтэй гэж бодож байна даа?